Dashboard Creation
Category: Mega-Polis → Visualisation → Visualisation Supporting Tools
Node ID:SvMegapolisDashboardCreation
Tooltip: Dashboard Creation
Dependencies:os(file writing). The generated script expectsstreamlitand any referenced libraries (Plotly, Bokeh, PyVista, etc.) in the runtime environment.
Functionality
Creates a Streamlit dashboard script file by assembling previously generated dashboard code snippets into a single runnable .py file.
The node:
- Receives a Folder path and a Dashboard Name
- Receives one or more Dashboard Components (code snippets generated by other dashboard nodes)
- Writes a Python file (e.g.,
<dashboard_name>.py) inside the given folder - Outputs the path to the created dashboard file
This node acts as the final assembler of the Mega-Polis dashboard pipeline.
It does not execute the dashboard — it only generates the script file.
Inputs
| Socket | Type | Description |
|---|---|---|
| Folder | SvStringsSocket | Path to the folder where the dashboard script will be created. Must be linked. |
| Dashboard Name | SvStringsSocket | Name of the dashboard file (without .py). Must be linked. |
| Dashboard Components | SvStringsSocket | List of Python code snippets generated by other dashboard nodes. Must be linked. |
All inputs must be connected for the node to execute.
Parameters
| Name | Type | Default | Description |
|---|---|---|---|
| run | Bool | False | When enabled, creates the dashboard file. |
Outputs
| Socket | Type | Description |
|---|---|---|
| Dashboard Path | SvStringsSocket | Full path to the generated Streamlit dashboard script. |
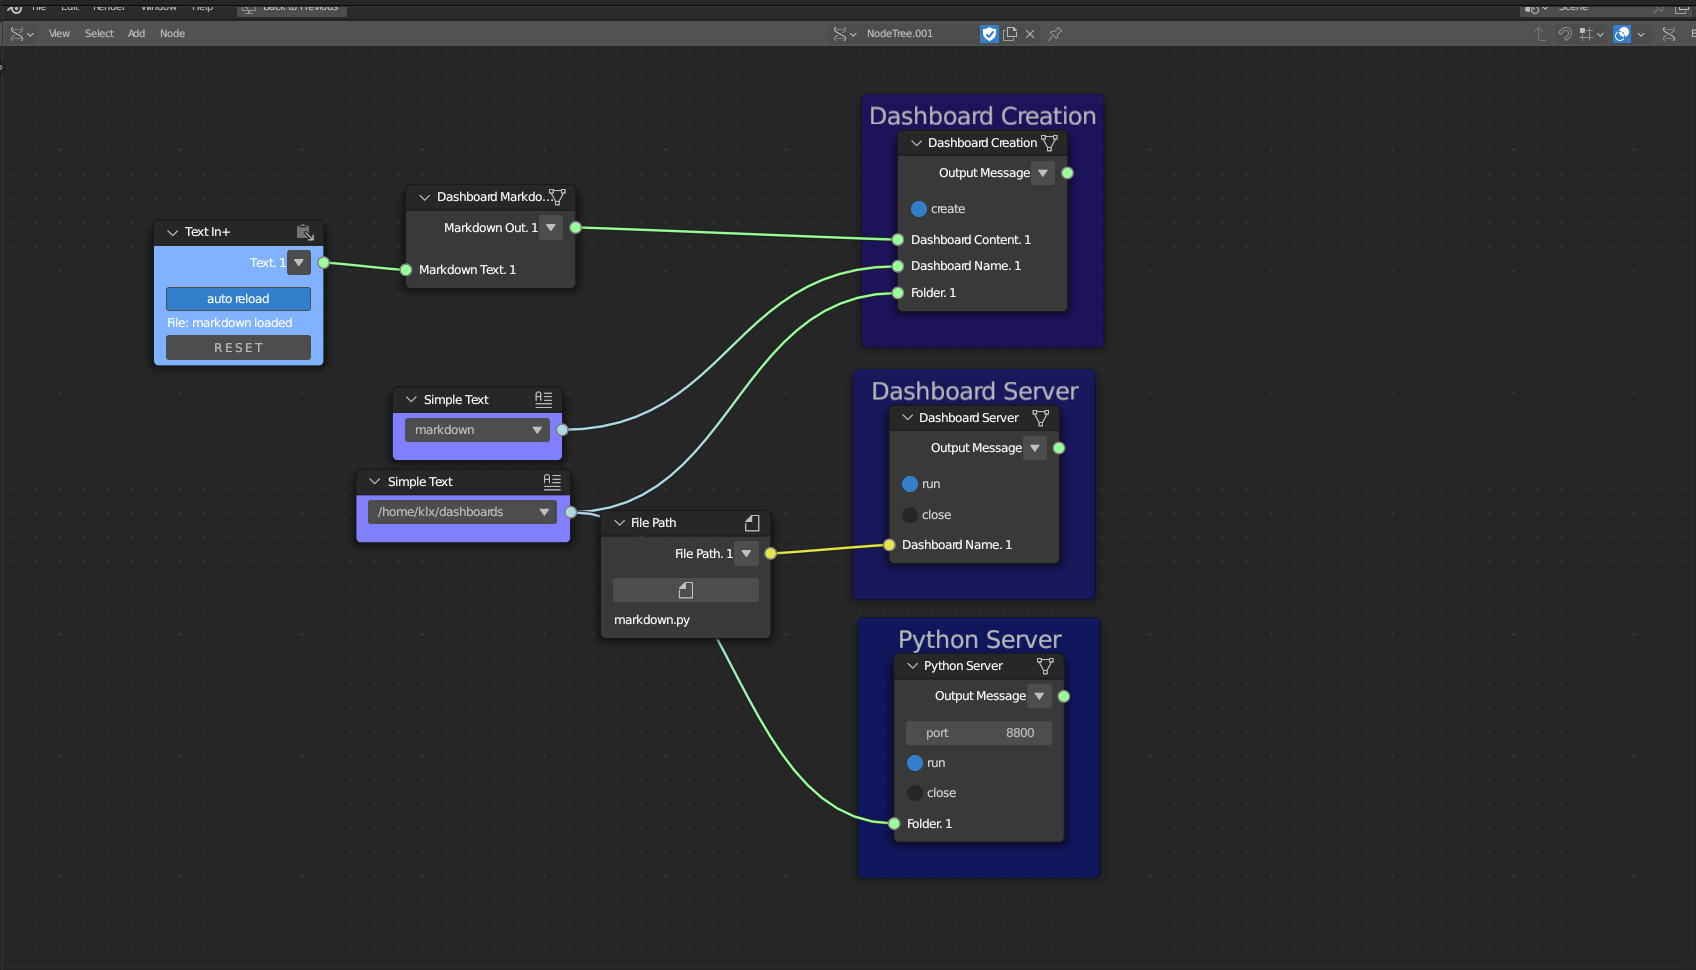
Example
Create a Streamlit dashboard
- Build dashboard components:
- Dashboard Markdown
- Dashboard Plotly Scatter
- Dashboard DataFrame
- Combine all snippet outputs into Dashboard Components.
- Provide:
- Folder →
"/tmp/megapolis_dashboard" - Dashboard Name →
"urban_analysis"
- Folder →
- Enable run.
- The node creates:
/tmp/megapolis_dashboard/urban_analysis.py